
If there’s one part of a business plan that founders struggle with most, it’s the financial projections in business plans.
I see it all the time in consulting calls. A founder walks in with a great product, clear market insights, and a strong story—yet when I ask, “How long can your business survive if sales drop next month?” the room goes quiet.
It’s not that they haven’t thought about it. It’s that their answer is usually based on optimism or a rough guess. And while instinct has its place, it’s no substitute for clear, credible numbers.
Done right, financial projections give you a data‑backed view of your future, showing potential growth, how you’ll survive slow months, manage cash flow, and fund your next move.
I’ve seen investors lose interest over vague numbers and lean in when the projections are realistic, well‑structured, and tied to strategy. In this article, I’ll show you why they matter so much.
What are financial projections in business plans?
A business plan’s financial projection is a company’s estimate of its financial performance in the future based on unique historical data and trends.
It gives an assumption of how much profit or loss your business might bring in the future—and helps you decide how you’ll allocate funds to repay debts and achieve business goals.
Whether you’re a new business just starting out or an existing business looking to scale—business financial projections help you see whether your plans on paper are sustainable in the long run.
Components to be included in financial projections
No matter how many years you project, these components should be included in financial projections for a business plan and remain non-negotiable:
Cash flow statement
The cash flow statement indicates your business’s cash inflows and outflows within a given time. It helps potential investors assess your ability to repay loans or manage operational costs.
When we review client plans, I often find this section either missing key details or too cluttered to read. A clear, well‑structured cash flow statement makes a big difference. It should break down into:
- Operating activities: Recognizes the cash that comes in from the core operations of your business—such as salaries, taxes, and rent.
- Financial activities: Stems from financial transactions—such as raising funding, obtaining loans, and distributing dividends.
- Investing activities: Related to the acquisition or sale of long-term assets—such as physical property and intangible assets like intellectual property.
Income statement
An income statement is a business’s profit and loss statement that summarizes a company’s revenues, expenses, profits, and losses over a fixed period.
It consists of your business’s revenue, expenses, and net income, and helps your potential investors get an idea about how sustainable your financial practices are and how they line up long-term.
Here are the details you’ll find in your income statement:
- Operating revenue: Income generated through a company’s primary activities—such as product sales.
- Non-operating revenue: Income that’s generated through a company’s secondary and non-core activities, such as interests and royalty payments.
- Cost of sales: Refers to the expenditure incurred by small businesses to earn operating revenue—for example, a car manufacturer when he buys spare parts.
- Gross margin: Calculated by subtracting the cost of sales from the operating revenue—a higher gross margin indicates that the business retains more capital for other expenses.
- Non-operating expenses: Refer to the expenses unrelated to the primary business operations—but necessary for day-to-day activities.
- Earnings before interest, tax, depreciation, and amortization (EBITDA): Derived by subtracting all non-operating expenses, excluding interest, tax, depreciation, and amortization, from the gross margin.
- Additional expenses: These include costs like interest payments, income taxes, gains or losses from exceptional item sales, and depreciation or amortization expenses.
- Net income/profit: Ultimate indicator of a business’s profitability, calculated by subtracting all expenses, including additional expenses, from the revenue.
Balance sheet
A balance sheet indicates your business’s financial position in a given time frame. It shows your company’s financial position at a glance—including financial statements, from your business’s liabilities, assets, and equity.
Assets represent everything the business owns that holds monetary value, including tangible items like cash, inventory, equipment, and property, as well as intangible assets such as trademarks, patents, and copyrights.
On the other hand, liabilities represent what the business owes to external parties. These can include loans, accounts payable, and bonds, which are further categorized as short-term or long-term obligations.
Finally, equity reflects the owners' stake in the business. It is determined by subtracting liabilities from assets and includes both contributed capital and retained earnings.
Steps for creating financial projections for your business plan
Follow these steps to create accurate financial projections in business plans:
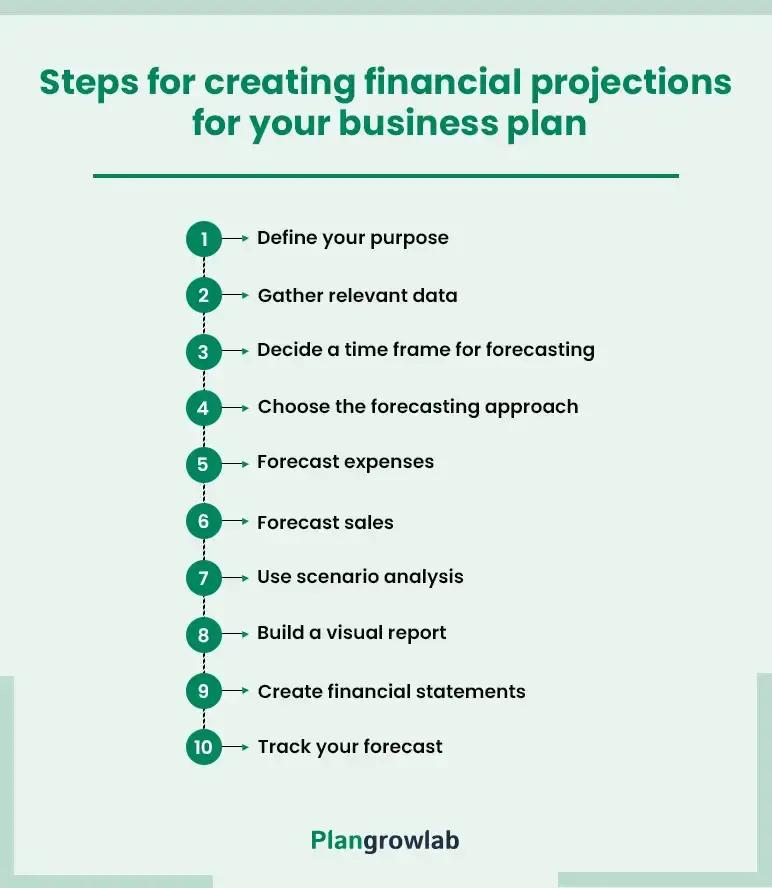
1. Define your purpose
Before you start pulling numbers, you need clarity on why you’re doing this. I’ve learned that when founders skip this step, they either overcomplicate their projections or miss the exact points their audience cares about.
Ask yourself: Who are you preparing it for?
If it’s for investors, they want to see growth potential, scalability, and profitability. If it’s for lenders, the focus shifts to repayment capacity and cash flow stability.
What do you want to achieve? Are you trying to secure funding, prepare for a loan, or simply manage your cash flow better? Your goal shapes the tone and content of your projections.
How far ahead should you forecast? For short-term funding or operational goals, a 1–2 year projection works. For strategic growth, aim for 3–5 years.
It’s common to see a 5-year forecast included by default. Unless your data and strategy genuinely support it, shorter, more accurate forecasts often work better.
2. Gather relevant data
Accurate projections don’t come from guesswork—they come from grounding your assumptions in real numbers. I often notice that even established businesses overlook the valuable data they already have sitting in past reports.
Pull together your key financial statements:
- Income statement that includes revenue, cost of goods sold (COGS), operating expenses, interest, tax, depreciation, and amortization.
- Cash flow statement that includes cash from sales, supplier and payroll payments, operating expenses, taxes, asset purchases/sales, investments, loans, dividends, and share buybacks.
- Balance sheet that includes cash, accounts receivable, inventory, property, equipment, investments, IP, accounts payable, loans, bonds, and mortgages.
For existing businesses, historical data is your best predictor of future trends. For startups, your projections will rely more on market research, industry benchmarks, and competitor performance.
One thing I always tell founders: If your historical numbers and your future projections don’t line up logically, you’ll lose credibility fast. It’s better to be conservative and believable than overly optimistic and easy to dismiss.
3. Decide on a time frame for forecasting
The time frame you choose for your financial projections can make or break their usefulness. I’ve seen founders pick a number (say “5 years”) just because it sounds professional. But if you can’t realistically forecast that far, it does more harm than good.
Ask yourself these questions to decide the time frame:
What type of goal do you have? If you’re tracking early performance or cash flow for a new product, a short-term forecast of 1–2 years is usually enough. For bigger, longer-term goals like securing investment or expanding operations, you’ll want at least a 3–5-year view.
How predictable is your industry? In fast-moving industries like technology or eCommerce, where markets shift quickly, 1–3 years is often more realistic. In stable sectors like retail or manufacturing, longer projections of 3–5 years can work.
What’s the stage of your business? Startups often lack the historical data needed for reliable long-term forecasting, so a shorter horizon is safer.
Established businesses, with past performance to draw on, can plan further ahead with more confidence.
4. Choose the forecasting approach
Once you’ve nailed down your time frame, the next step is to choose your method. At PlanGrowLab, we typically work with two main approaches:
| Qualitative forecasting | Quantitative forecasting |
|---|---|
| 1. It is a method of predicting future outcomes based on information that cannot be directly measured. | 1. It is a method of predicting future trends and outcomes based on measurable data. |
| 2. Important for startups since there’s no historical financial data. | 2. Important for any existing business since it’s based on historical financial data. |
| 3. Best for long-term financial forecasting, for new businesses with no past data to look back on. | 3. Best for short-term forecasting of existing businesses as there’s past performance to consider. |
| 4. Relies on financial statements like sales reports and expense sheets. | 4. Relies on expert opinions, market research, and industry insights. |
Let me show you an example of how this plays out in practice:
If you run a hair serum company that’s been operating for several years, quantitative forecasting would be your best bet—using past seasonal demand, monthly sales trends, and promotional results to predict future volumes.
If you’re a new business, I’d prioritize qualitative forecasting—consulting with hair care experts, studying market research reports, and reviewing competitor performance to build credible assumptions.
The key is to pick a method that fits your data reality.
5. Forecast expenses
In my consulting work, I often see founders underestimate expenses because they forget to factor in the hidden costs that creep in over time. If your projections don’t include these, you’ll end up with a financial plan that looks great on paper but falls apart in reality.
The first step is to list fixed and variable expenses. Established businesses can break these down by department or product line, while startups often need a detailed breakdown of one-time startup costs.
Using our hair serum example, predictable monthly fixed costs might be:
- Rent = $2,000
- Employee salaries = $3,000
- Utilities = $500
Total fixed costs = $5,500/month
Variable costs per bottle:
- Ingredients = $8
- Packaging = $2
- Labor = $2
Total COGS per bottle = $12
If you project selling 2,000 bottles in Month 1, that’s $24,000 in production costs. Add marketing ($5,000) and shipping ($2,000), and your total variable costs are $31,000.
Total expenses = $5,500 (fixed) + $31,000 (variable) = $36,500
Add a 10–15% contingency to protect against price hikes or supply delays, and you’re closer to $40,150 per month.
From experience, this contingency buffer is often the difference between
6. Forecast sales
An accurate sales forecast will help your business—optimize resource allocation, ensure better cash flow management, and plan for growth.
To forecast your sales, start by gathering reliable data for your business. For established businesses, this means looking at historical sales data. For new businesses, market research and competitor analysis are the only options.
Then choose a sales forecasting method. Though there are many methods to rely on, at the fundamental level—all you need is reliable data and the ability to derive informed references.
Let's take our hair serum example to forecast sales.
Suppose your income statement shows sales for the past six months:
- Month 1: 800 bottles sold
- Month 6: 1,800 bottles sold
This shows consistent growth of 200 bottles per month. Based on this trend, your predicted sales will continue to grow by 200 bottles monthly.
Now, factor in market trends, let’s say—your last campaign brought you a 25% sales boost in the first month and 15% in the second month.
- Month 7: 1,800 bottles projected + 25% = 2,250 bottles
- Month 8: 2,250 bottles projected + 15% = 2,588 bottles
It’s now time to account for risks—maybe your consistent historical data shows supply chain issues by the end of the year.
Assuming the same, you can factor in potential supply chain issues and delay shipments in Month 9—reducing sales by 400 bottles:
- Month 9: 2,588 bottles - 400 bottles = 2,188 bottles
With operations back to normal, sales will now resume the initial growth trend.
- Month 10: 2,188 bottles + 200 bottles = 2,388 bottles
- Month 11: 2,388 bottles + 200 bottles = 2,588 bottles
In the 12th month, as per your business’ past trends, let’s say sales will increase by 25% during the holiday season:
- Month 12: 2,588 bottles + 25% = 2,875 bottles
This shows your sales forecast for the upcoming six months, considering market conditions and risks. Now, you know how many bottles of hair serums you’ll sell.
The key isn’t just to predict growth but to bake in risks. We’ve helped clients win over investors simply by showing a “realistic” forecast that plans for bumps in the road instead of pretending they won’t happen.
7. Use scenario analysis
We all tend to focus on the best outcome, but the truth is, the worst has a way of showing up when you least expect it. That’s why it’s worth running a scenario analysis that covers not only your best-case forecast but also a realistic case and a worst-case.
Start by identifying the factors that could’ve the biggest impact on your revenue and expenses. Then build a financial model for each scenario. For example:
Best case: Sales exceed expectations, manufacturing costs drop, and overhead decreases.
Worst case: Customer churn spikes, raw material prices climb, or demand falls unexpectedly.
Walking into an investor meeting and saying, “Here’s how we’ll thrive if things go better than expected and here’s how we’ll handle it if they don’t,” shows you’ve done the hard thinking. It signals you’re prepared and not relying on blind optimism.
8. Build a visual report
Instead of wading through endless spreadsheets, I like to turn projections into visual reports such as graphs, charts, and dashboards, so trends and patterns are instantly clear.
For example, if our forecast for a hair serum client showed steady sales of 1,000 bottles a month but a viral influencer post pushed sales to 1,500, a simple line graph made that spike impossible to miss.
I’ve found that visual reports not only make updates easier for stakeholders to digest, but they also make you look more prepared and confident. And in high‑stakes funding discussions, that extra clarity can make all the difference.
9. Create financial statements
Once you’ve mapped out expenses, sales, revenue, and visual summaries, it’s time to pull everything together into your three core financial statements: the cash flow statement, income statement, and balance sheet.
This is the stage where I see many founders either get stuck or cut corners. Some try to piece it together manually, which is possible, but in practice, it often leads to small errors that compound over time.
Others rely entirely on AI or pre-built templates, which can give a neat-looking spreadsheet but often miss the nuances of their market, seasonality, or unique cost structure.
When we prepare projections for clients, we treat this step as building a financial narrative. The statements have to align with your business model, reflect realistic assumptions, and stand up to investor scrutiny.
Done well, they don’t tell you where your business stands today and how it will perform under real-world conditions. That’s where the real value of financial projections comes through.
10. Track your forecast
Creating your financial forecast is the easy part, but keeping it alive is where most founders slip. I’ve lost count of how many times I’ve reviewed plans where the numbers looked good six months ago but no longer reflect reality. When that happens, you’re making decisions with outdated information, and that’s dangerous.
Take a hair serum brand, for example, projecting steady monthly sales of 1,000 bottles. A seasonal boost takes them to 1,500—great news—but at the same time, supplier shortages push production costs through the roof. Without updating the forecast, you’re planning based on yesterday’s reality, not today’s.
That’s why we build update systems into forecasts from day one. It's about flagging shifts early so you can react before they snowball. A forecast you revisit monthly becomes a decision-making tool. Once you ignore becomes a false sense of security.
Why do you need financial projections in your business plan?
Financial projections aren’t just numbers for the sake of it. They’re your roadmap for revenue, expenses, and profitability. From what I’ve seen in, they often decide whether a founder makes confident, data‑driven choices or runs the business on instinct alone:
- Your business goals turn into measurable targets you can track.
- You can separate your budget into what’s essential now vs. what can wait.
- You’ll know exactly how much funding you need and how it should be allocated.
- Decisions about hiring, expansion, and investment become evidence-based.
- You can show investors and lenders a credible repayment plan backed by numbers.
Common mistakes to avoid in financial projections
I can’t tell you how many times I’ve reviewed projections that looked great, until I dug into the details. Here are the mistakes I see most often:
Overestimating revenue
Overestimating revenue can result in overspending and cash flow issues. So try to base your financial forecasts on real numbers and thorough market research.
Missing hidden costs
Variable and hidden costs can pile up over time and lead to fund shortages. So, always include all your potential costs, including one-time, fixed, and even variable.
Ignoring cash flow
Don’t focus only on profits because a business may look profitable on paper. That’s why detailed monthly cash flow statement projections are required.
Skipping market research
It’s tempting to rely on assumptions, but in my experience, the strongest projections are backed by credible data. Without it, the numbers are just educated guesses.
Not testing “what if” scenarios
It’s easy to plan for the best case, but I’ve found the smartest projections also stress‑test the worst. What happens if sales dip, costs climb, or a supplier falls through? Running these scenarios up front gives you a clearer view of your risks and helps you prepare solutions before you need them.
Project your financial future with Plangrowlab
By now, you know almost everything about creating financial projections for business plans from scratch. With the right effort, time, and tools, you can estimate future sales, map out expenses, and compile financial statements. There are even AI tools that can help you streamline the whole process.
But while these options work, they often fall short of providing the accuracy, insight, and adaptability that expert financial consultants bring to the table. Experts can analyze your business’s specific needs, industry trends, and potential risks to create tailored forecasts that align with your goals.
Our experts at Plangrowlab do exactly that. With our financial forecasting service, you can connect the dots between raw data and real-world decisions to present numbers that are both compelling to investors and practical for guiding your growth.
Frequently Asked Questions
Why are financial projections necessary?
Financial projections are essential for guiding decisions, attracting investors, predicting the future financial situation, and measuring success. When you have a clear projection, you can plan for growth, avoid pitfalls, and ensure you’re steering toward profitability.
What are the main components of a financial projection in a business plan?
The main components for creating your financial projections for a business plan are annual income statements, cash flow statements, and balance sheets.
Can I create financial projections without historical data?
Yes, you can create financial projections without historical data but you will have to start with market research, competitor data analysis, and cost and expense estimates. However, as there’s hardly any concrete data available, the accuracy might vary.
How to present financial projections in a business plan?
To present the financial projections in a business plan, start by summarizing your expected revenue, expenses, and profits for the next 3-5 years. But don’t forget to factor in operational costs, market demand, and break-even analysis to keep the assumptions realistic. If there’s any complex data in your projection, it might be difficult to understand—you can use visuals to ensure it’s easy to understand.
What’s the difference between financial projection and financial forecast?
A financial forecast uses current trends and historical data to predict outcomes, while a financial projection models future performance based on variables like sales capacity, workforce, and market trends.

Follow Vinay Kevadiya